Chrome DevTools for SuiteScript 2.1 Script Debugging
The 2.1 Script Debugger offers a subset of the full Chrome DevTools features found in Chrome.
Only SuiteScript 2.1 scripts can be debugged using the 2.1 Script Debugger. You cannot use the 2.1 Script Debugger to debug SuiteScript 1.0 or 2.0 scripts.
Some of the following information, provided as a summary of the Chrome DevTools as it can be used in debugging JavaScript, is from Chrome DevTools. Refer to that site for complete information.
Also refer to Debug JavaScript and JavaScript Reference for additional help specific to debugging JavaScript code.
Chrome DevTools is a set of web developer tools built directly into the Google Chrome browser. Chrome DevTools can help you edit pages instantly and diagnose problems quickly. The JavaScript section of the Chrome DevTools site (JavaScript) has tutorials and videos showing you how to debug your JavaScript code. Most of these are included in the 2.1 Script Debugger. Se 2.1 Script Debugger Overview for a list of capabilities provided in the 2.1 Script Debugger.
Use Ctrl+Shift+I to access Chrome DevTools from the Chrome browser. Note that you do not have to do this when debugging SuiteScript2.1 scripts because NetSuite automatically provides the Chrome DevTools capability in a separate browser tab.
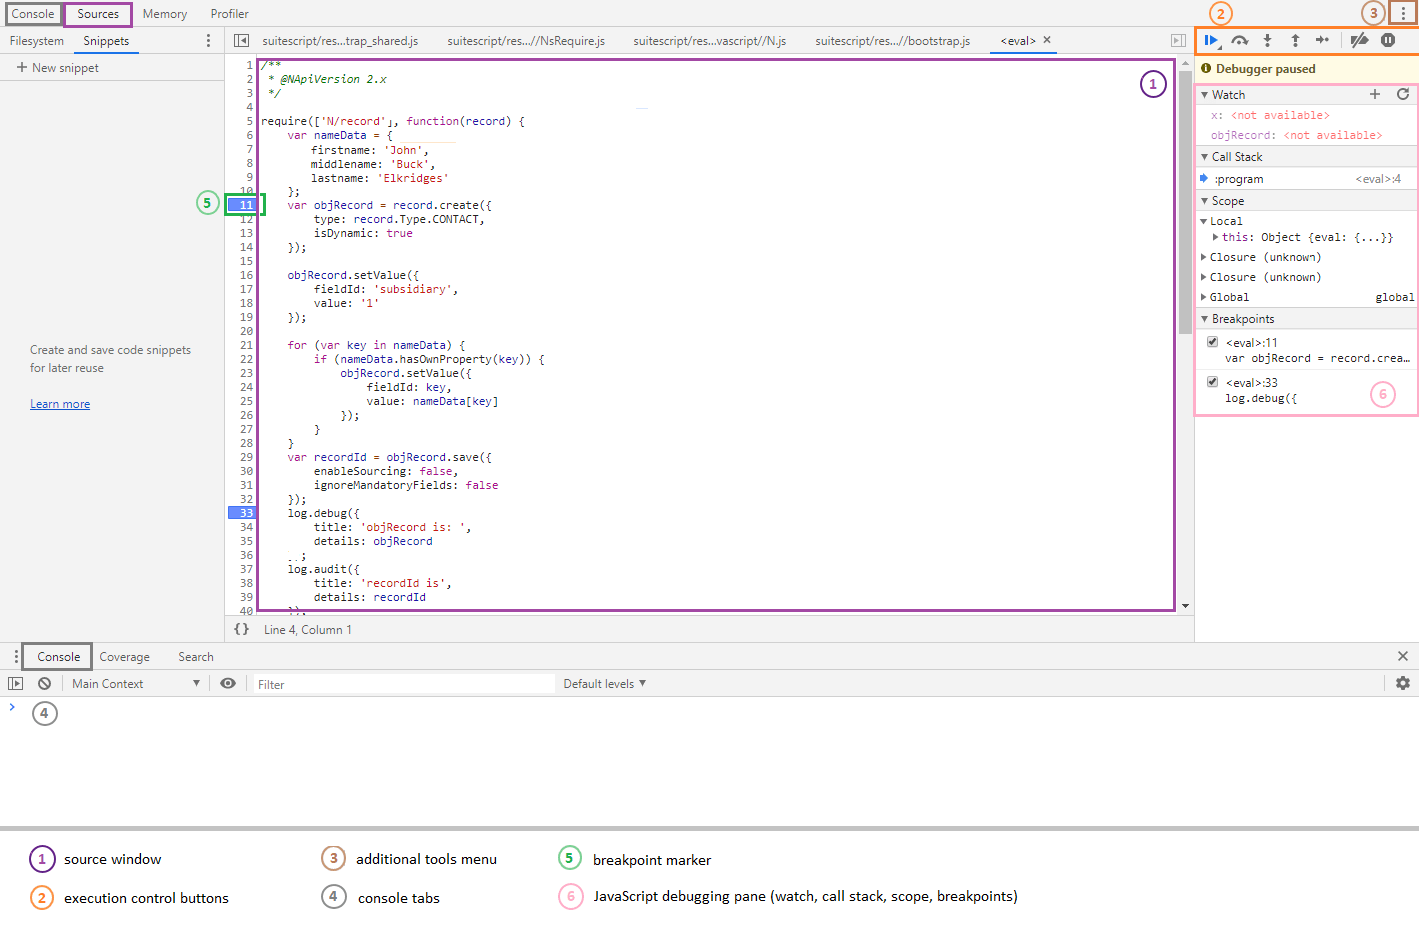
The following figure shows a sample Chrome DevTools Sources tab opened for debugging SuiteScript 2.1 scripts.
Chrome DevTools for SuiteScript 2.1 scripts supports the Console and Sources tabs only. Currently, there is no support for the Memory or Profiler tabs when debugging SuiteScript 2.1 scripts.

Use of Chrome DevTools for NetSuite SuiteScript 2.1 script debugging adheres to all license parameters as described at Chrome DevTools License.
To use Chrome DevTools, see Using Chrome DevTools.