Debugging the beforeLoad Entry Point Example
After you create the user event script and start the debugger, you debug the beforeLoad entry point. For more information, see Creating the User Event Script and Starting the Debugger Example.
To debug the beforeLoad entry point:
-
Follow the steps above to create the user event script and start the debugger.
-
To trigger the beforeLoad entry point, either create a new Customer or edit an existing Customer.
-
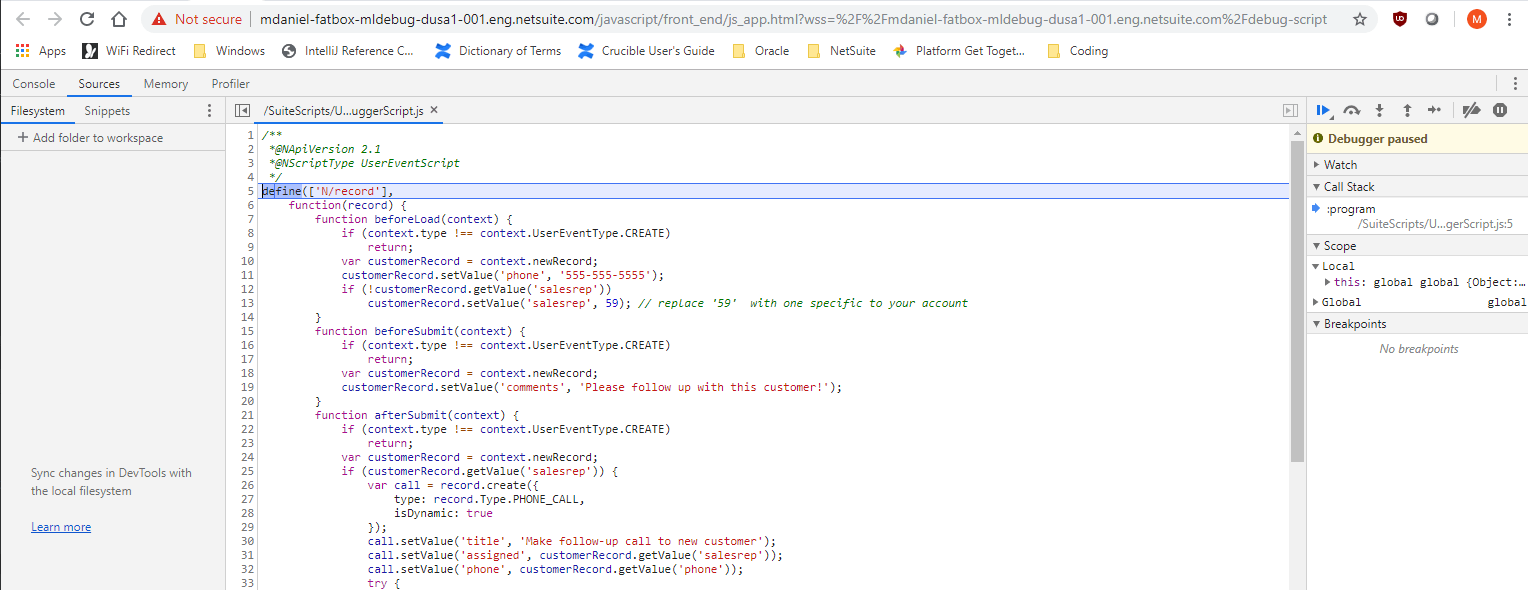
When the customer record is loaded, a new Chrome DevTools tab opens in your browser showing your user event script ready to be debugged using the 2.1 Debugger:
-
The execution of your script stops at the top of the script. You can now add breakpoints, watches, and so on, and begin debugging your script. You can also add a
debugger;statement at the top of the beforeLoad entry point code to specifically stop the execution of the script at that entry point. -
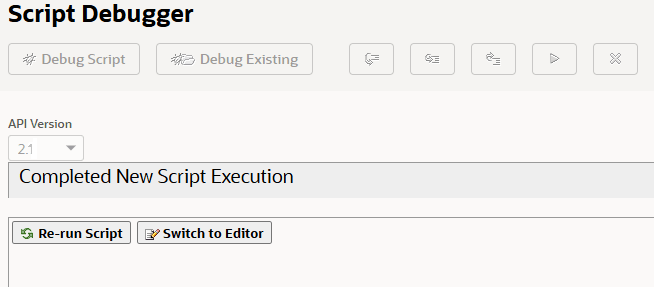
When you have finished stepping over/playing through the last line of the beforeLoad entry point code, the Script Debugger tab will show:
And you will see a message in the Chrome DevTools tab that indicates the debugging connection was closed:
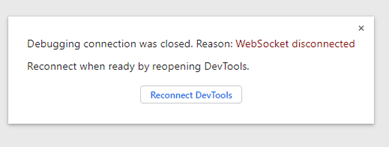
You don't need to click the Reconnect DevTools button on this message. If you want to reexecute the beforeLoad entry point in your script, save the Customer record to restart the debugging session.