Debugging the beforeSubmit and afterSubmit Entry Points Example
After you debug the beforeLoad entry point, you debug the beforeSubmit and afterSubmit entry points. For more information, see Creating the User Event Script and Starting the Debugger Example and Debugging the beforeLoad Entry Point Example.
To debug the beforeSubmit and afterSubmit entry points:
-
Go to Customization > Scripting > Script Debugger. Or, if you are already in the Script Debugger from debugging the beforeLoad entry point, execute the script again.
-
Create a new Customer or edit an existing Customer. Do not save the record yet. You first need to get ready to debug the script, as shown in the next steps, before clicking Save.
-
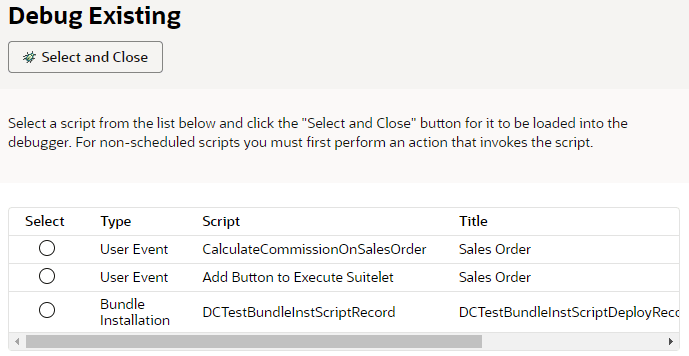
Select Debug Existing and select the Debug Customer w/ 2.1 UE user event script:
-
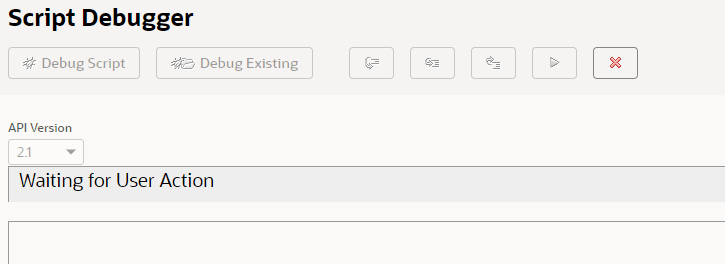
Click Select and Close. The Script Debugger waits for a user action to proceed:
-
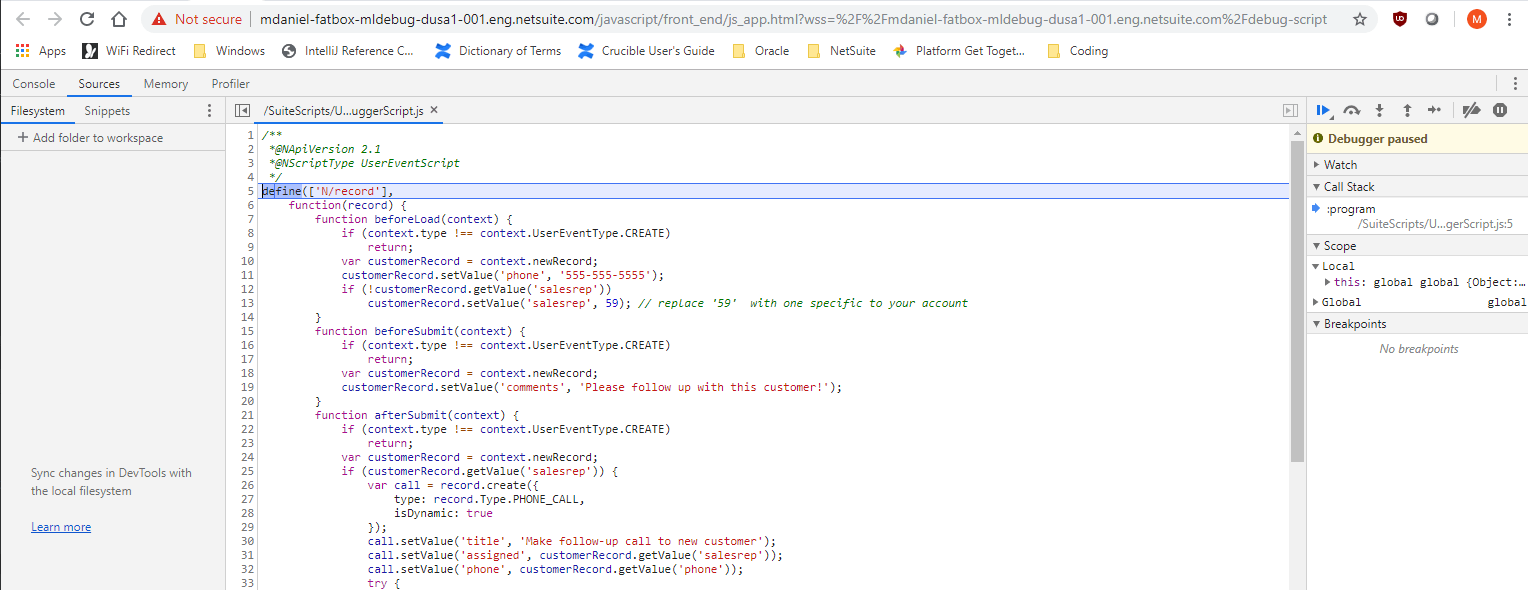
To trigger the beforeSubmit entry point, save the Customer record. A new Chrome DevTools tab opens in your browser showing your user event script ready to be debugged using the 2.1 Debugger:
-
The execution of your script stops at the top of the script. You can now add breakpoints, watches, and so on, within the beforeSubmit entry point and begin debugging your script. You can also add a 'debugger;' statement at the top of the beforeSubmit and afterSubmit entry point code to specifically stop the execution of the script at that entry point.
-
After the last line of the beforeSubmit function executes, the following message will appear in the Chrome DevTools tab:
And the Script Debugger shows:
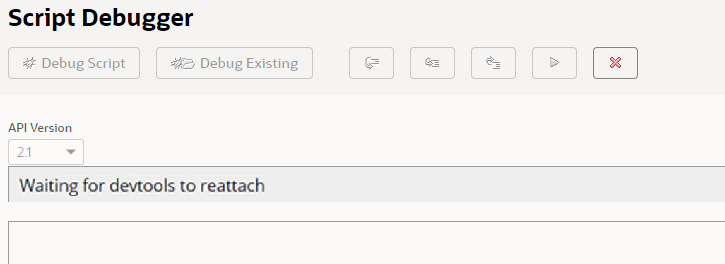 Note:
Note:This reattach phase only appears if you have both a beforeSubmit and an afterSubmit entry point in your user event script. If you have only the beforeSubmit entry point or the afterSubmit entry point, your debugging session will end at the completion of the entry point code.
-
To reattach the debugger and continue to debug your afterSubmit entry point code, click the Reconnect DevTools button on the message. The Chrome DevTools tab will reload your script and execution will stop at the beginning of the afterSubmit entry point code. You can now add breakpoints, watches, etc. and begin debugging your script.
-
When you are done stepping over/playing through the last line of the afterSubmit entry point code, the Script Debugger tab will show:
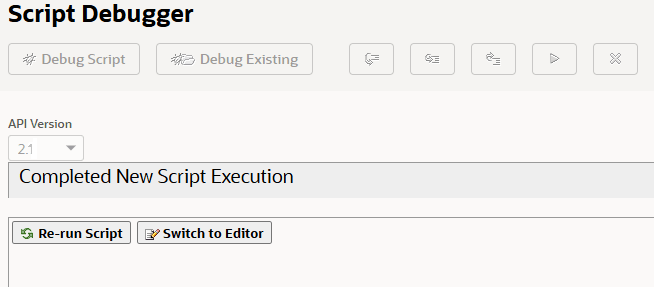
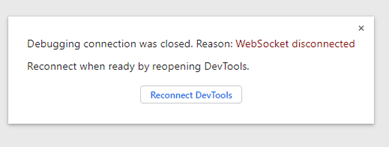
And you see a message in the Chrome DevTools tab that indicates the debugging connection was closed:
You do not need to click the Reconnect DevTools button on this message. If you want to re-execute any entry point in your script, you need to reload a customer record and follow the steps to debug the beforeLoad entry point or to debug the beforeSubmit and afterSubmit entry points.